
Console Data · Part of Premium
The desk behind the chart.
Live gold prices, multiple chart timeframes, session patterns and measured strategy signals on a board you arrange yourself.
Create a free account, then add Premium to open Data.
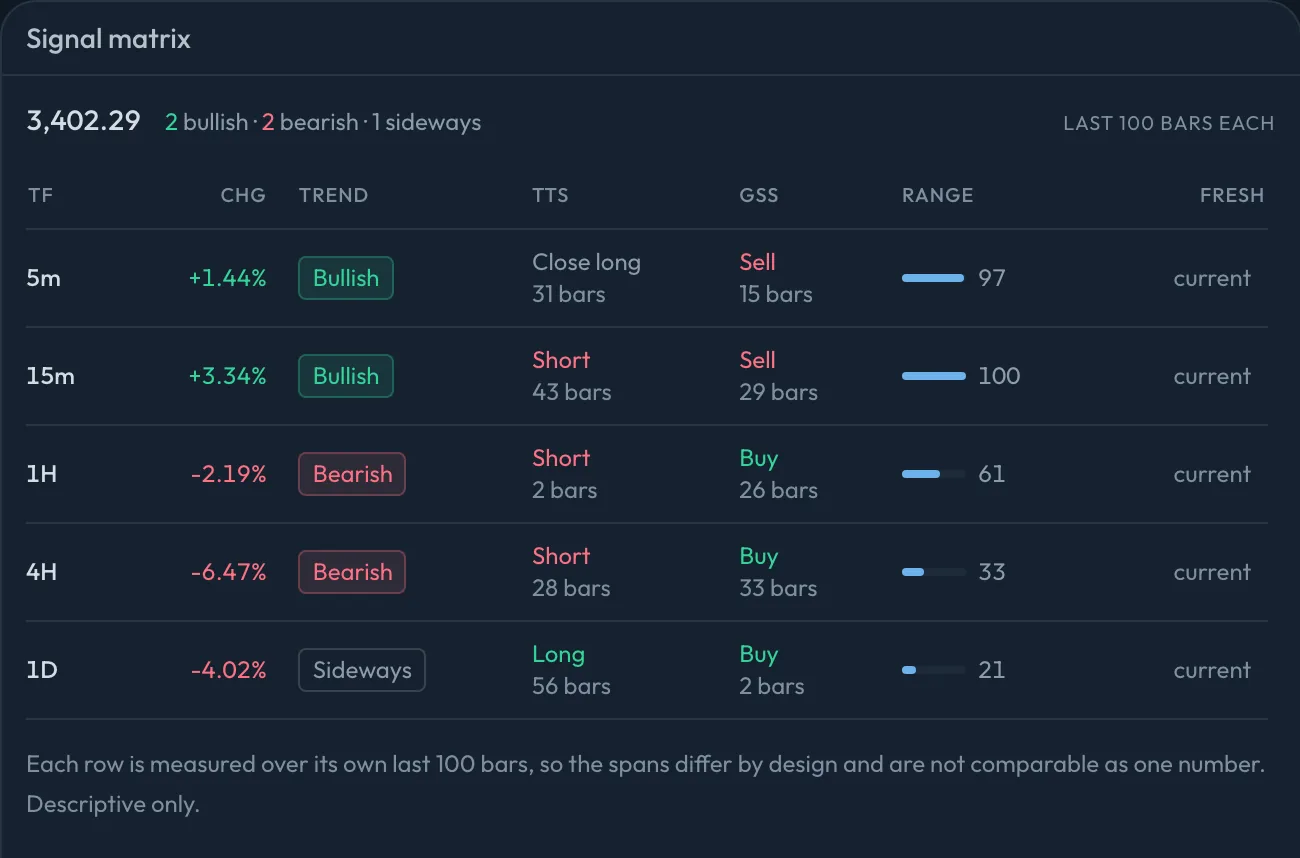
Every timeframe at once
The signal matrix reads gold from five minutes to the daily in one table: the trend, both indicators, and where price sits in its range.
Where the timeframes agree
Each row is measured over its own last 100 bars. When the short frames turn while the daily holds, you see it before you trade it.
BullishBearishSideways
Signals you can check
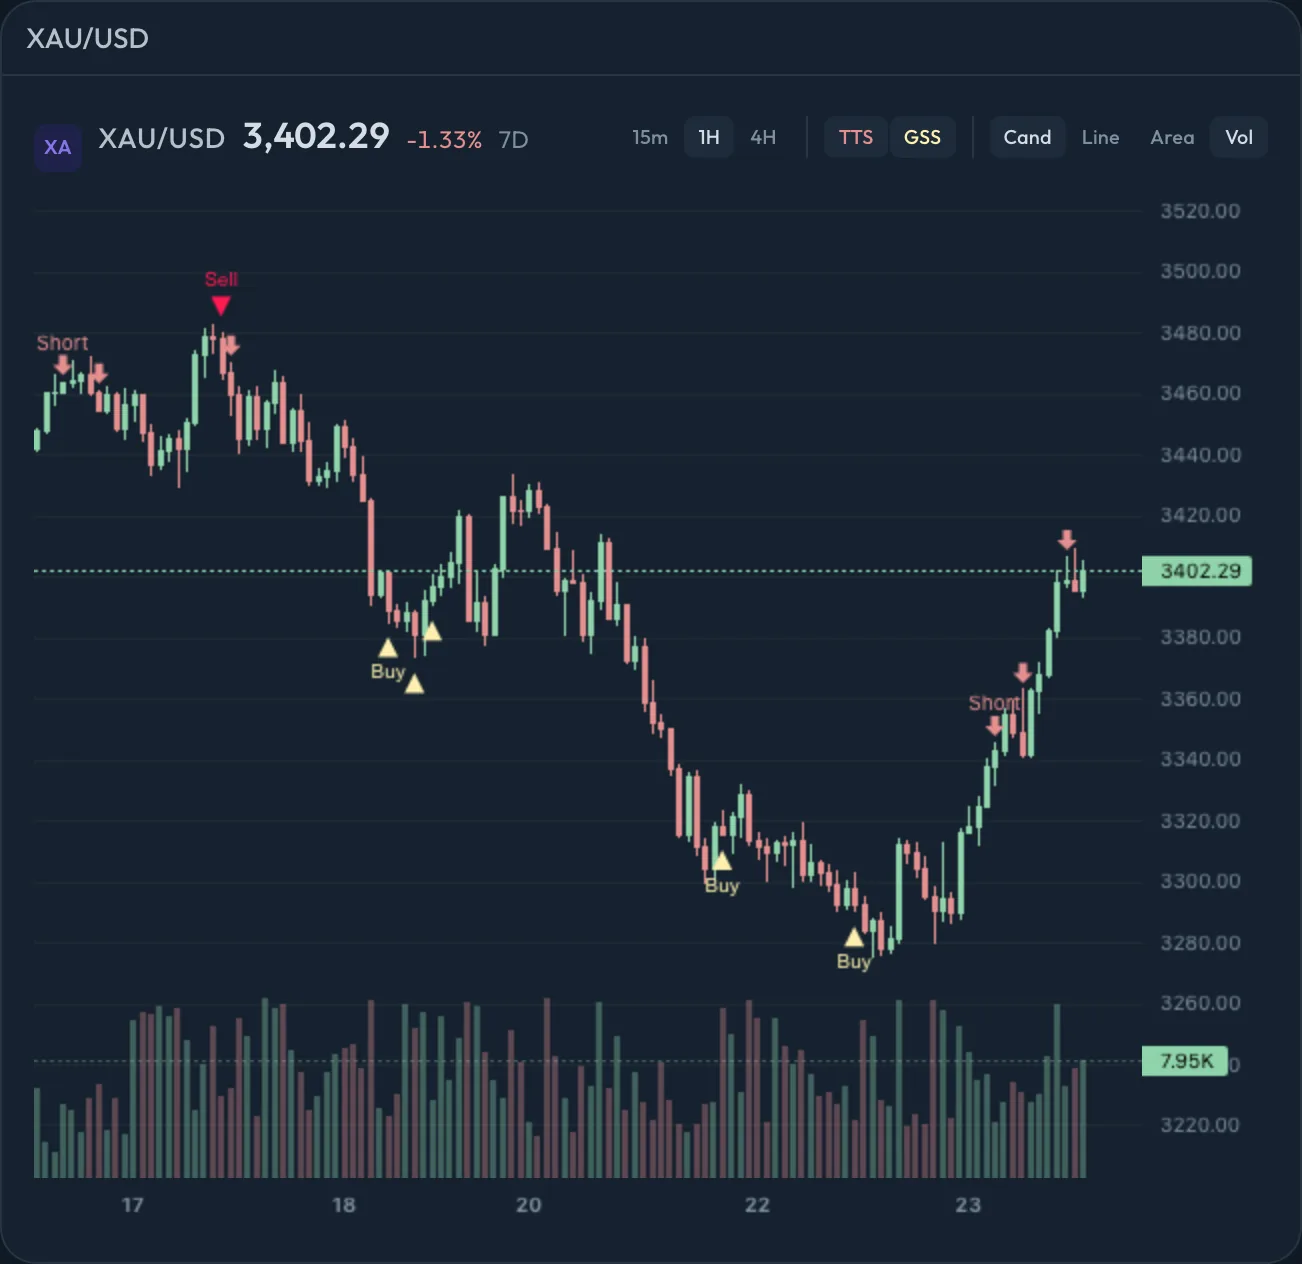
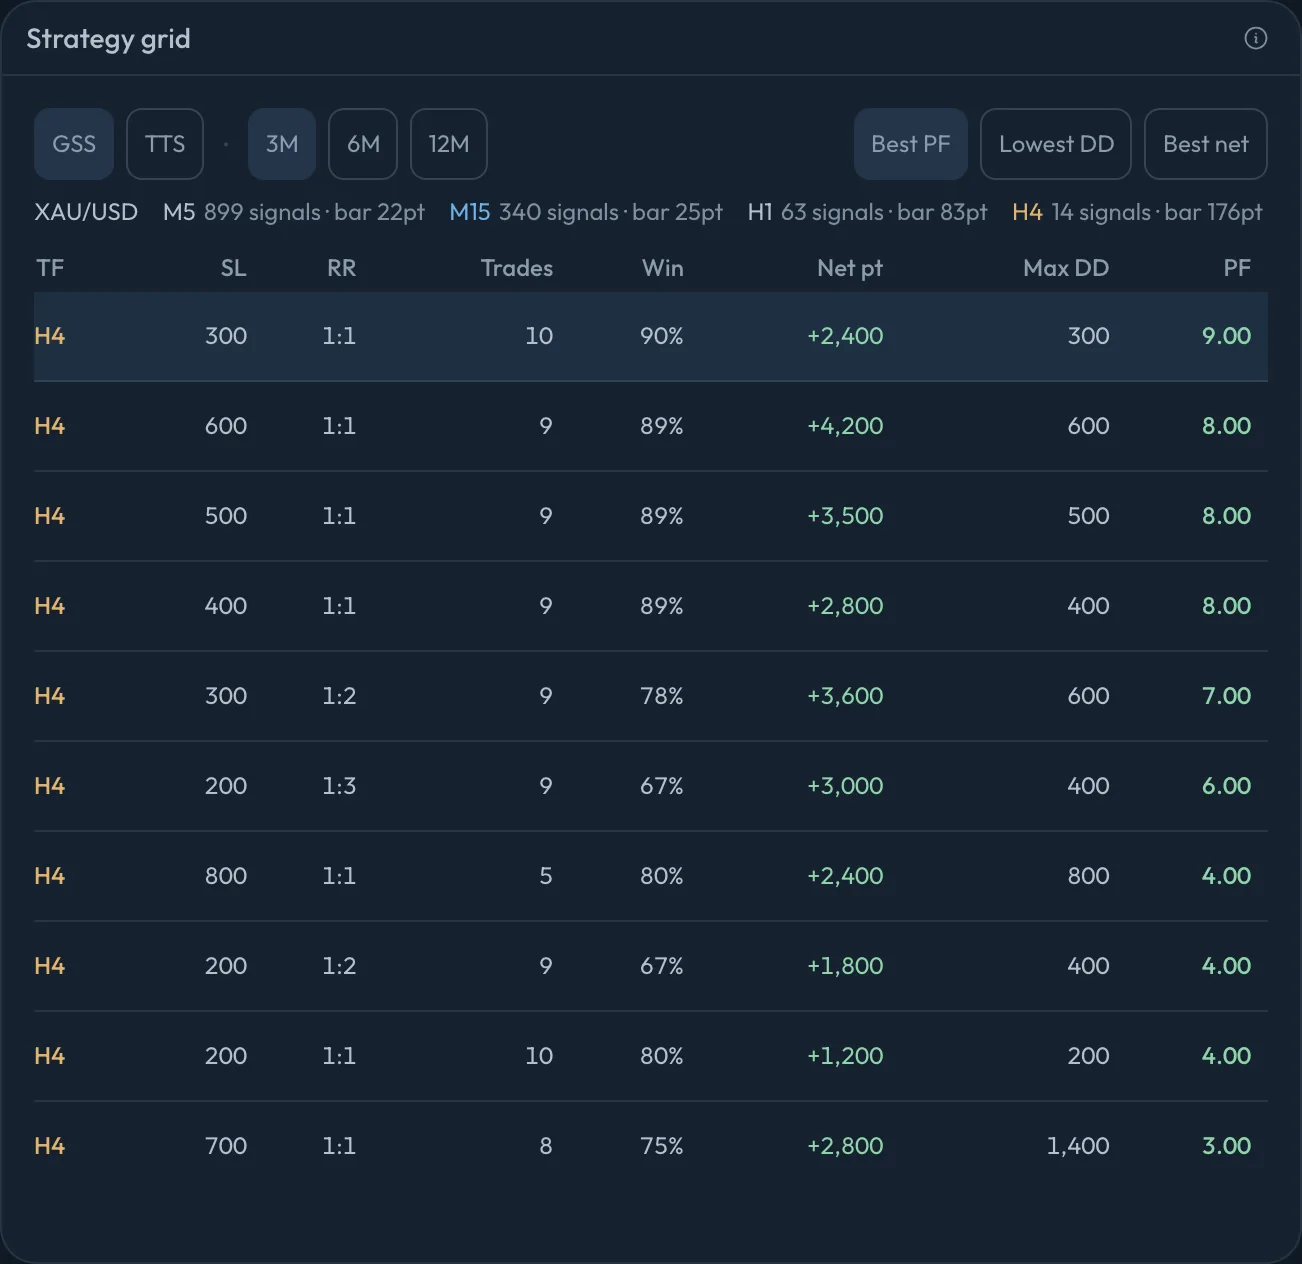
The chart carries both indicators, and the strategy grid shows what they would have paid.
Both indicators on the chart
TTS and GSS marks exactly where they fired, on the timeframe you pick.
What the signals would have paid
Every stop and target tried over the last months, ranked by profit factor, drawdown or net.
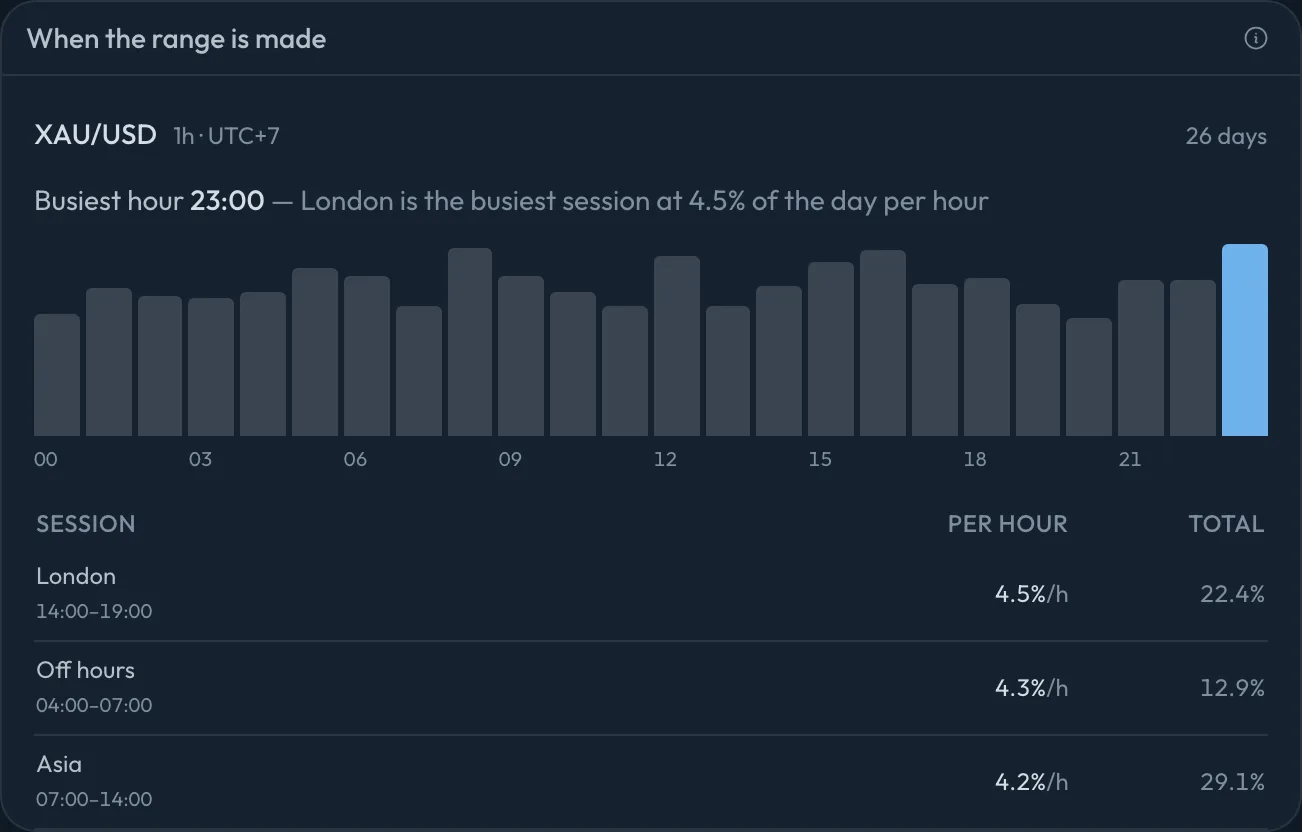
When the range is made
The session profile shows which hours of the day carry gold's range, in your own time zone, so you know when the screen is worth watching.
A board you arrange yourself
Seven widgets, any size, and a tab for each way you read the market.
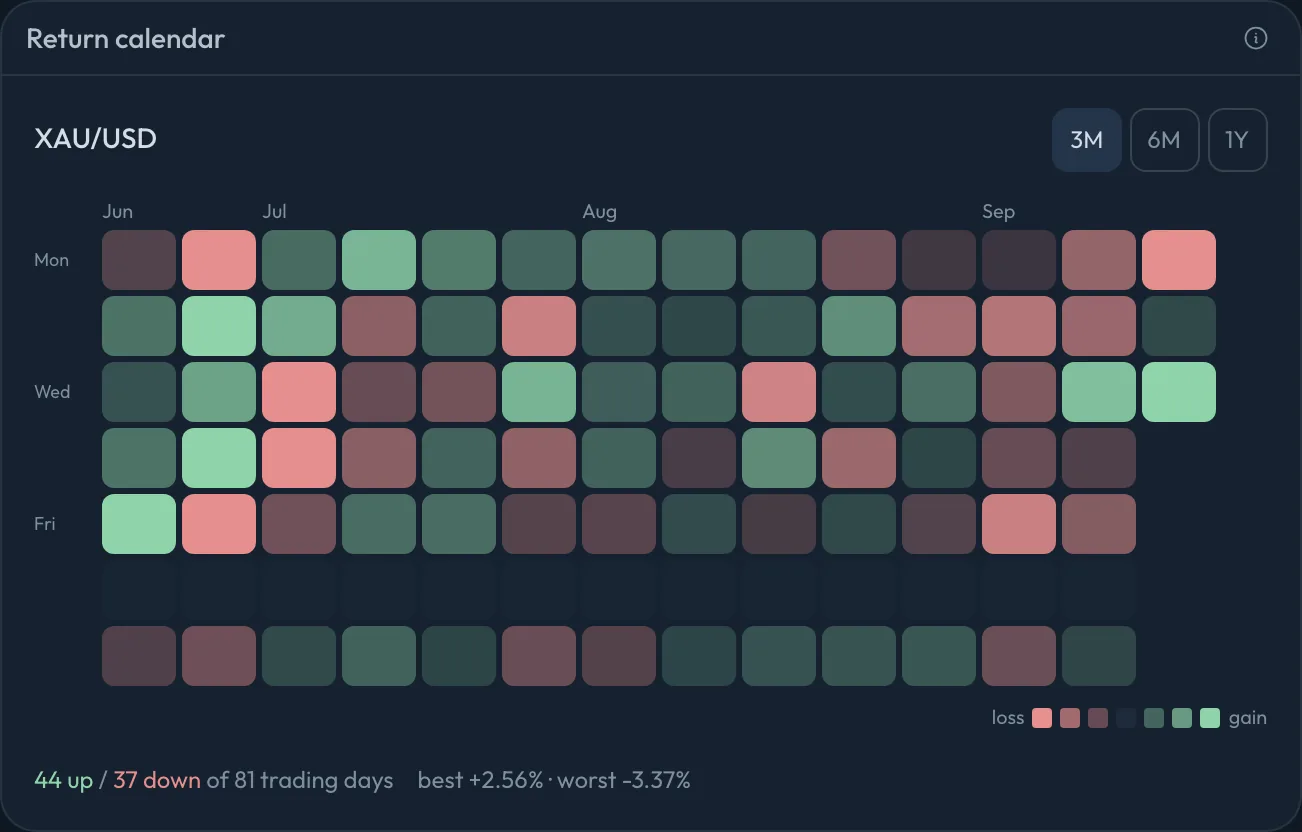
Every day, green or red
The return calendar turns the last months into a heatmap of daily returns.
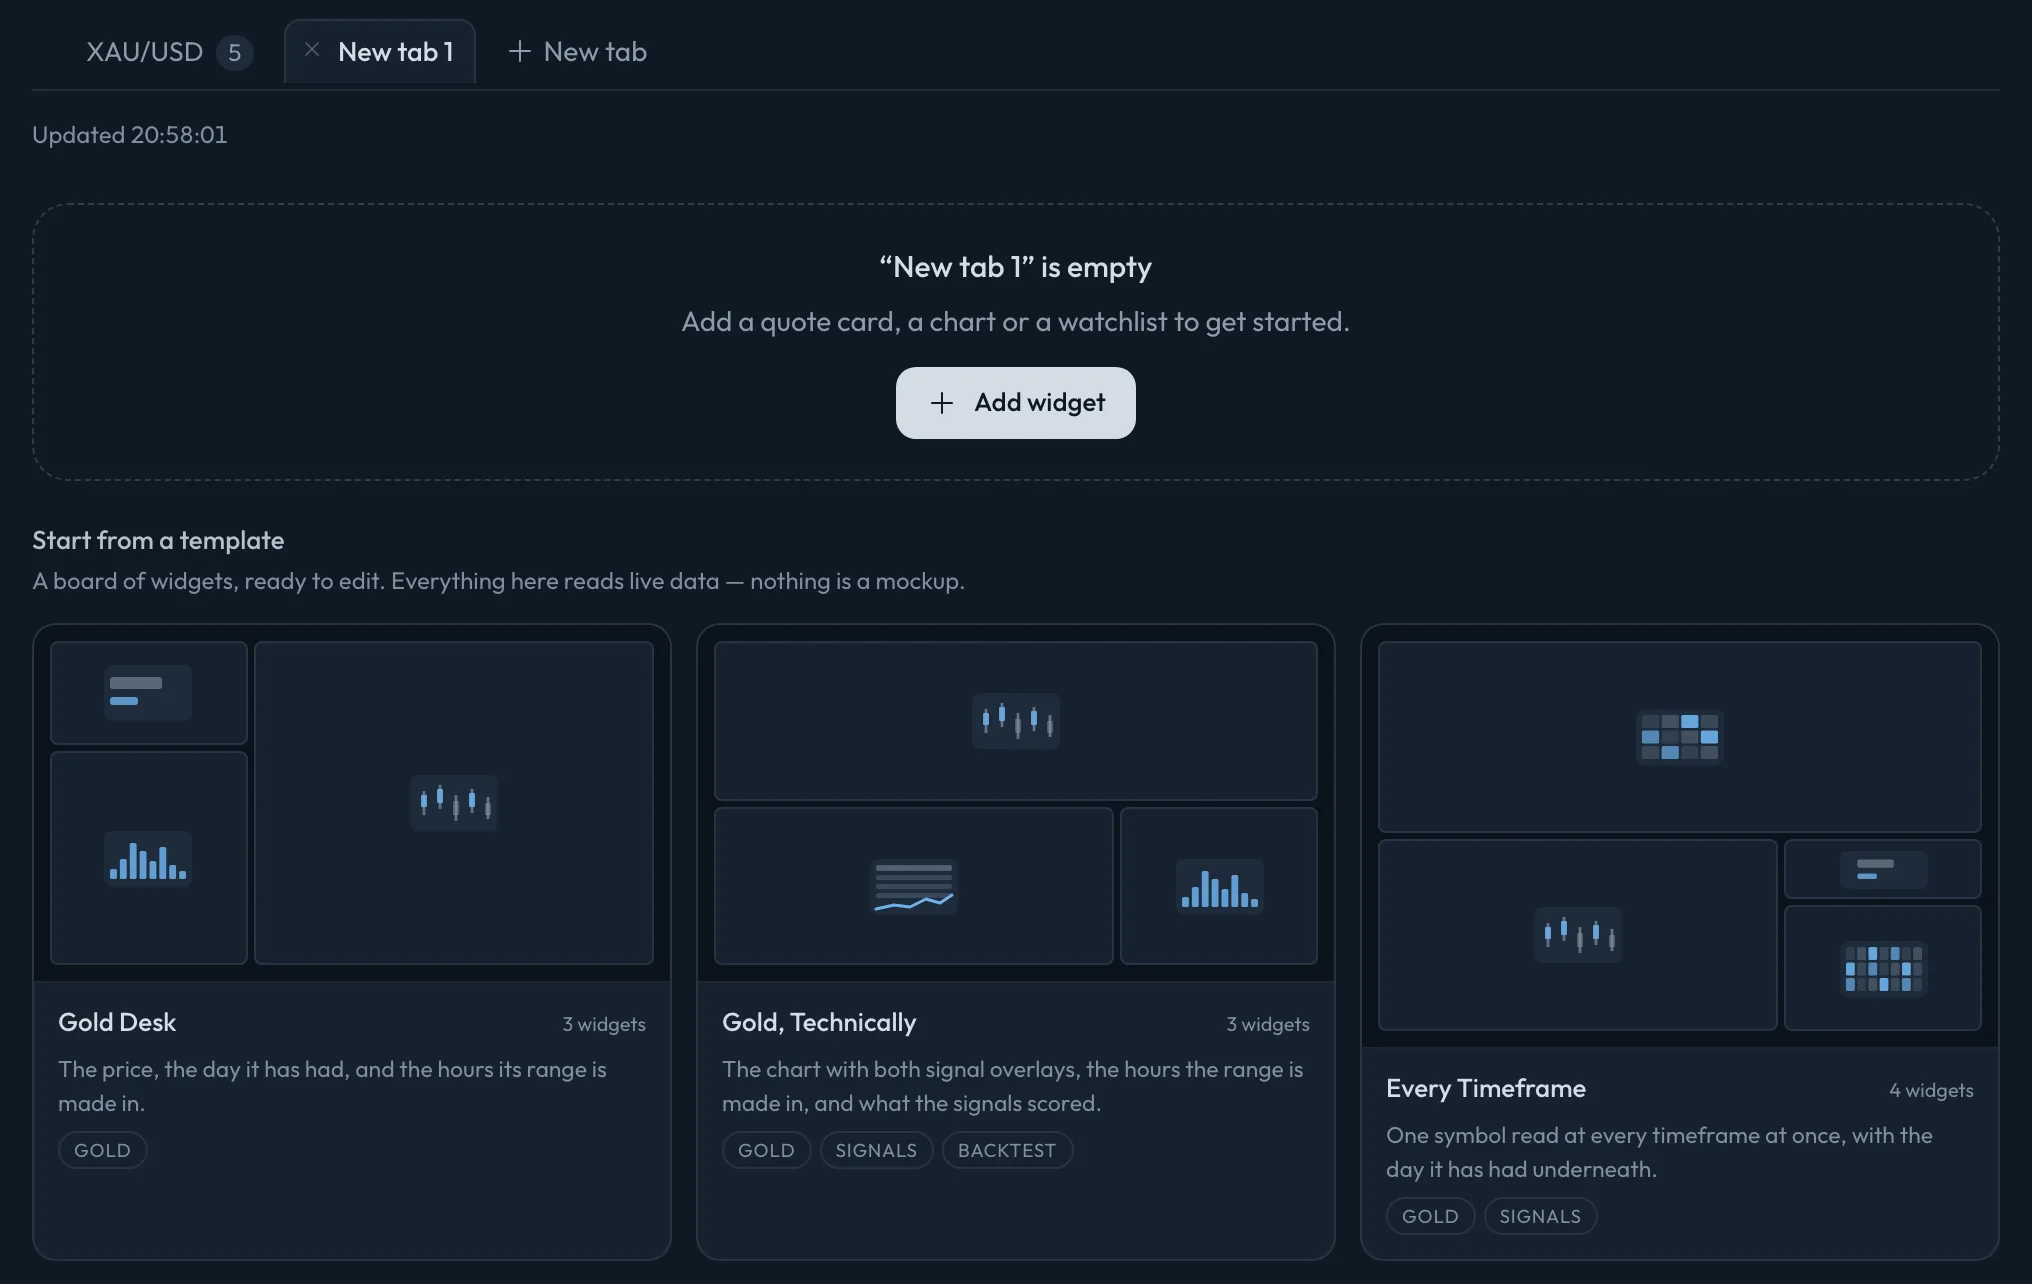
Start from a board
The Full Board opens as an editable tab with every widget already on it.
Open it in two minutes
Data runs in your workspace, with nothing to install.
- Create your account and add PremiumConsole Data is part of Premium, with Portfolio and every Pro tool.
- Open Data in your workspaceStart from the full board, or from an empty tab.
- Make it yoursAdd widgets, resize them, and keep a tab for each view of the market.
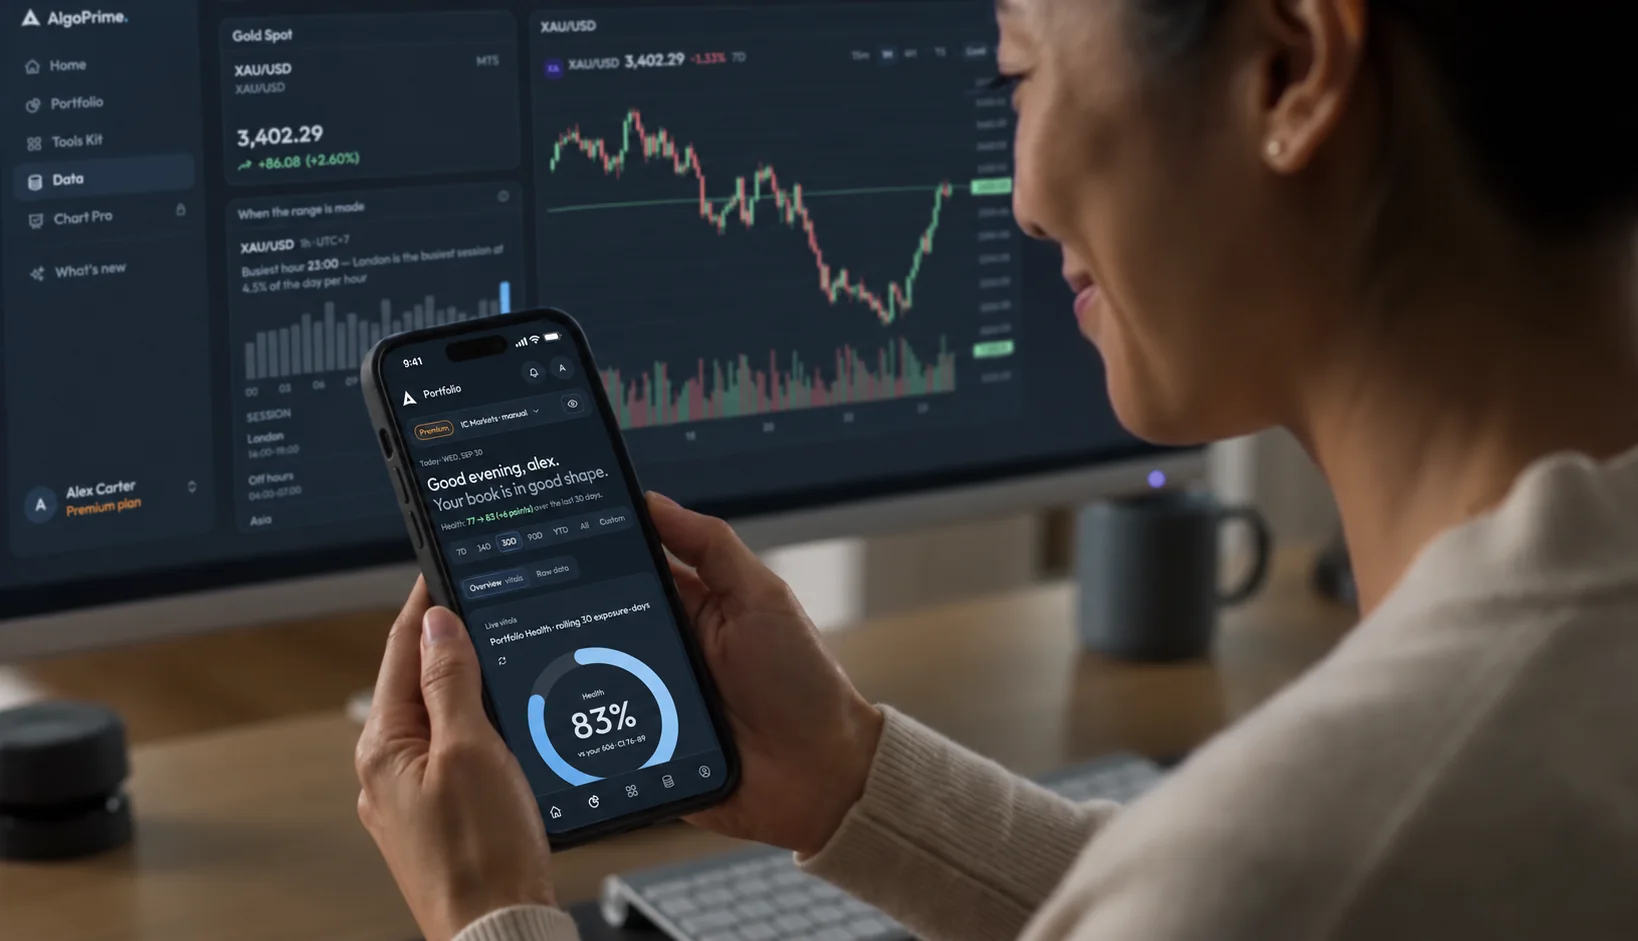
Build your desk.
Gold prices, signal context and strategy history in one workspace.
Create a free account, then add Premium to open Data.